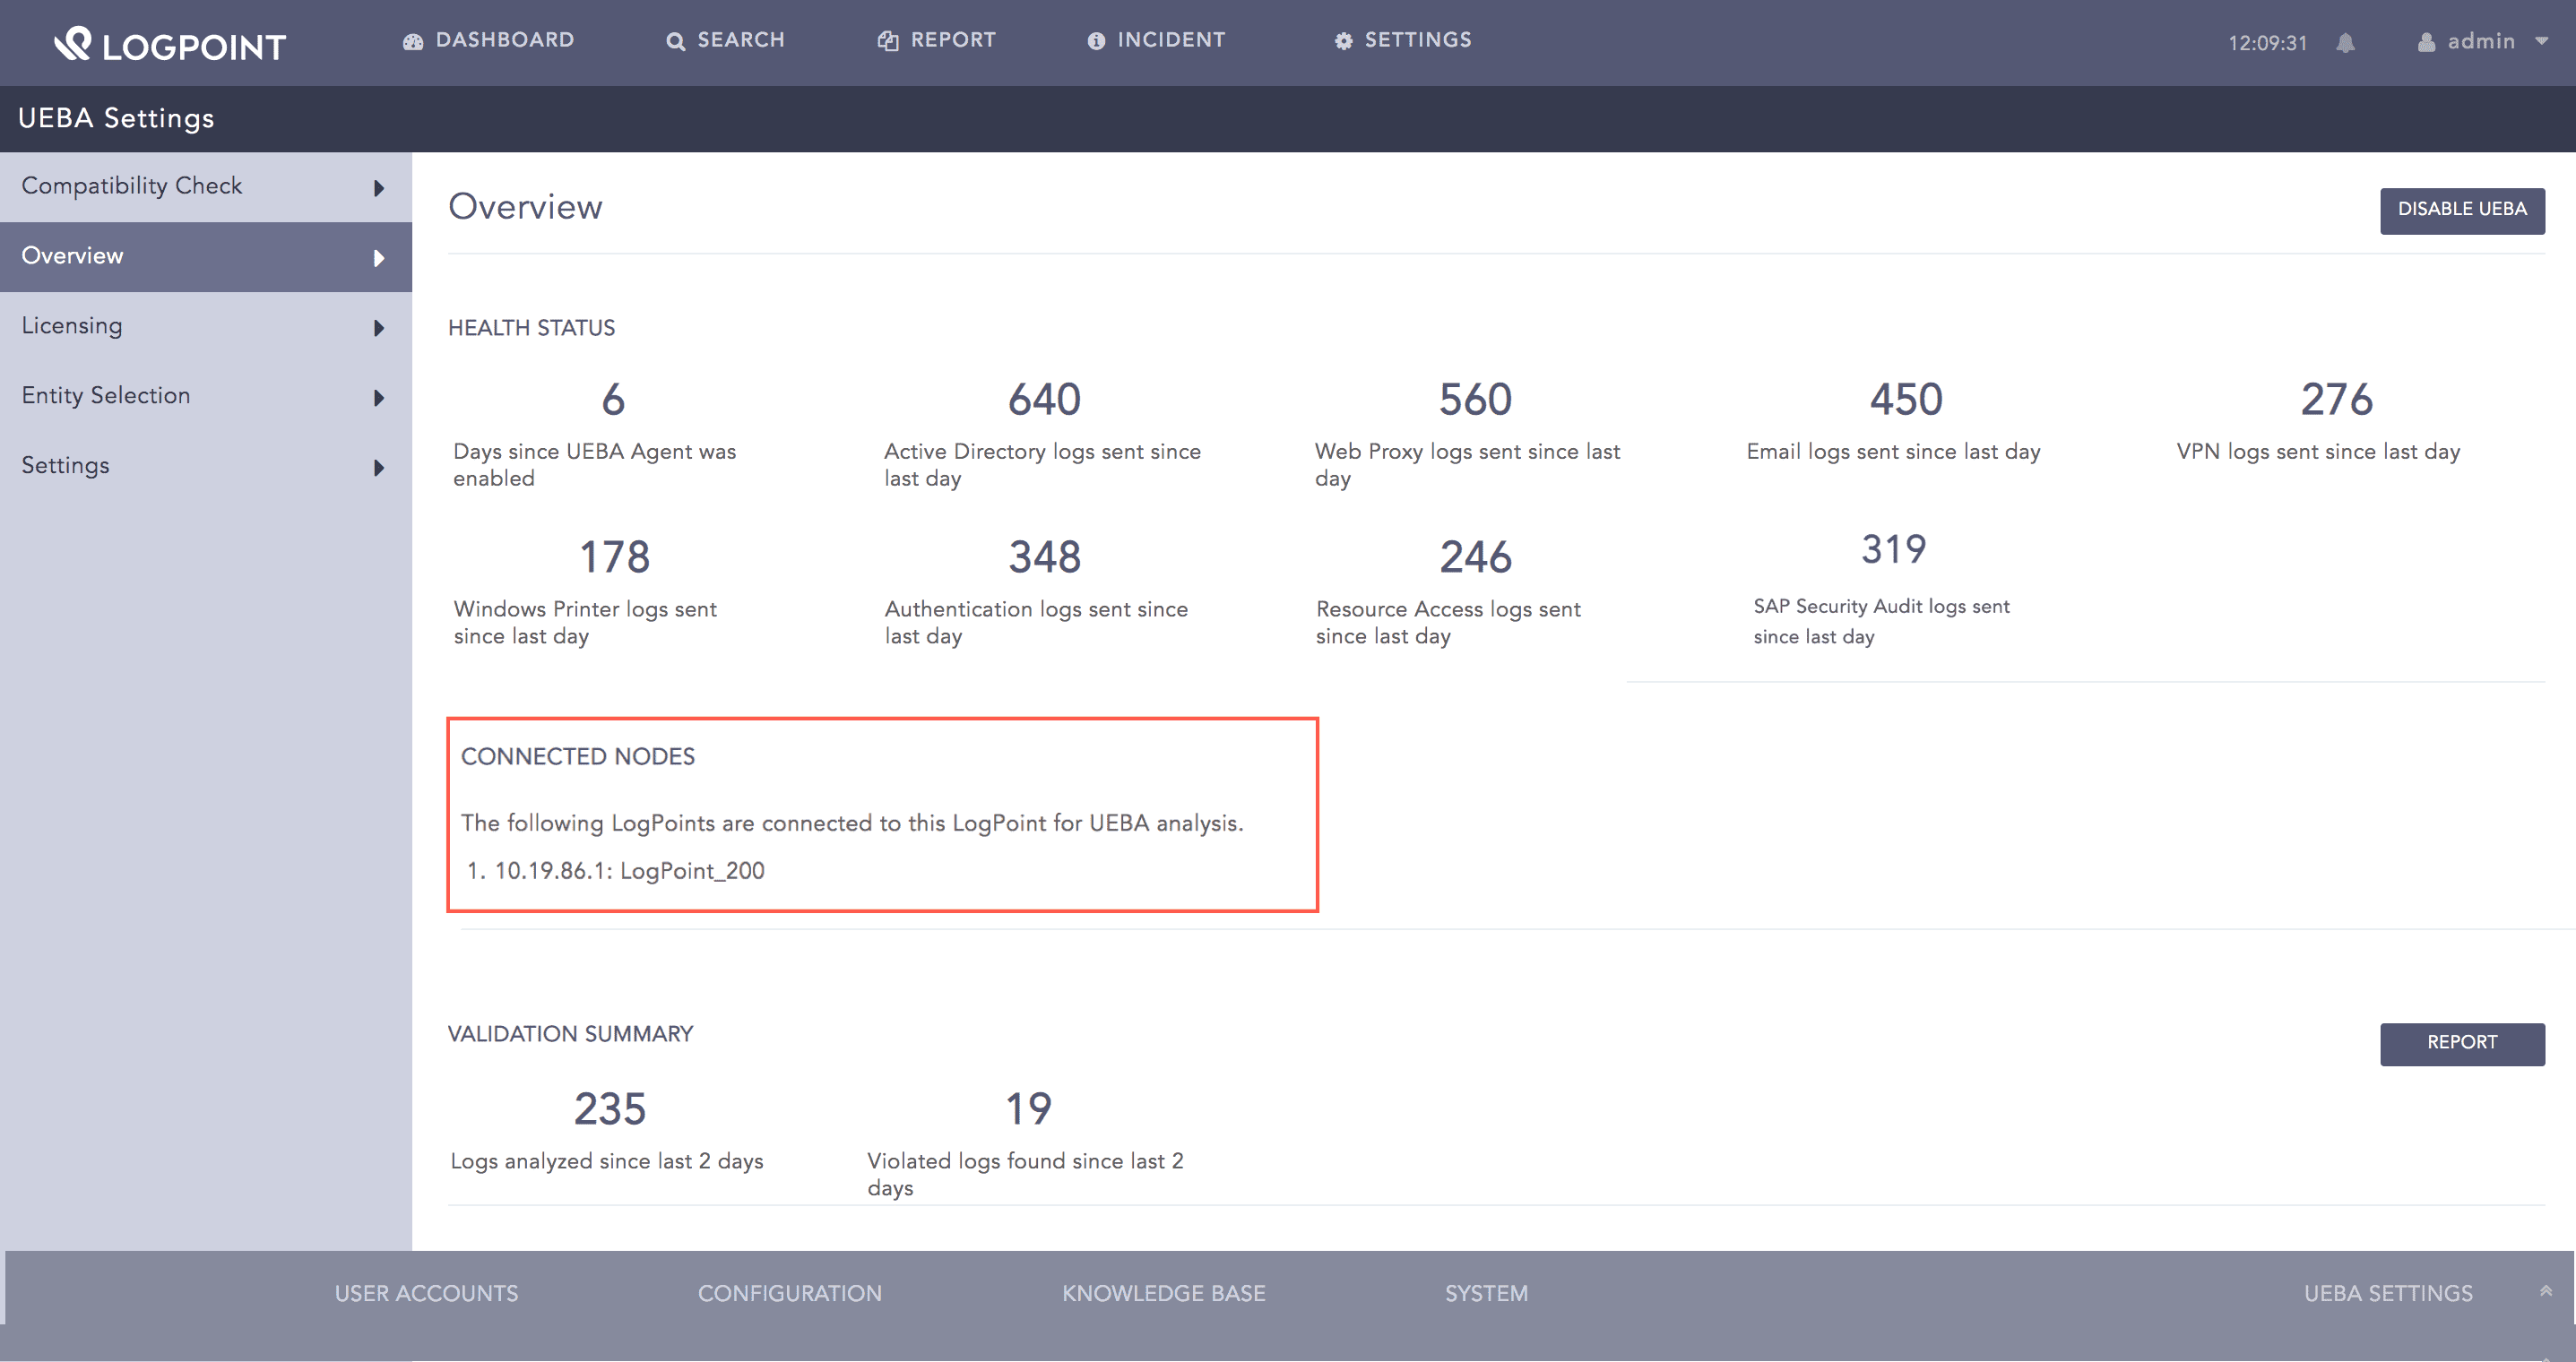
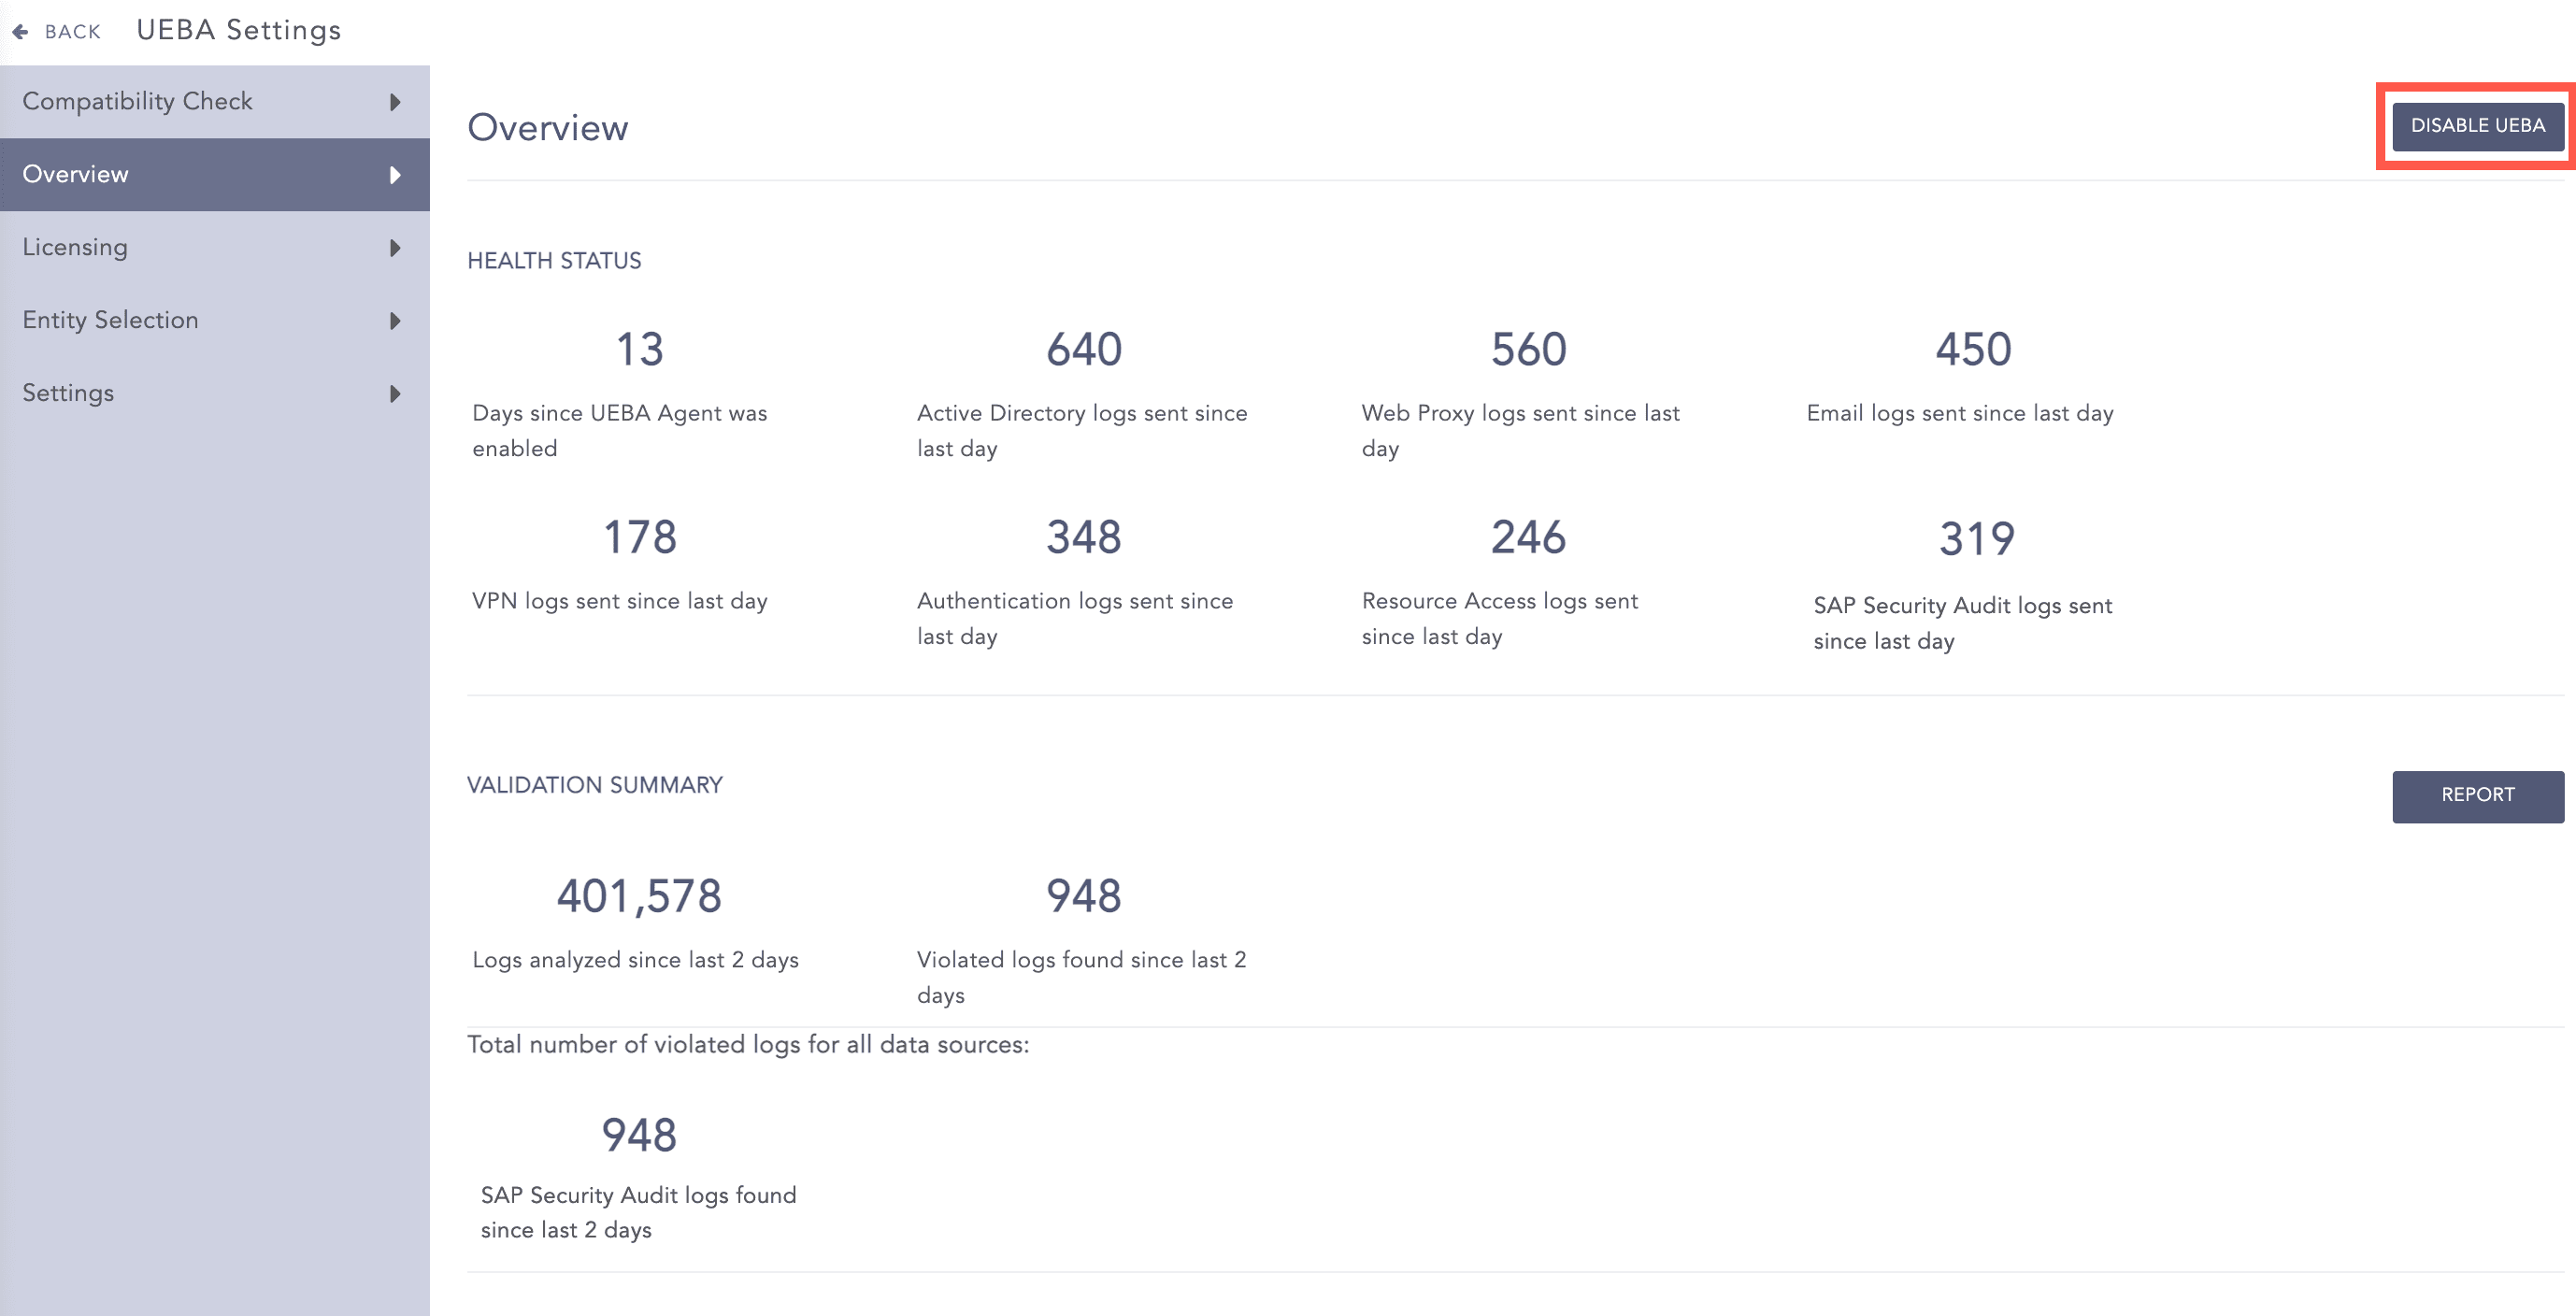
The Overview page lets you enable or disable UEBA, displays the health status of the system, and shows a list of all the Distributed LogPoints connected to the Search Head for UEBA analysis.
In the Distributed LogPoint mode, you can enable UEBA only in the LogPoint Search Head. However, if you have not selected any repos of the Distributed LogPoints in the Search Head, you can enable UEBA in the Distributed LogPoints as well.
Note
Before enabling UEBA, you need appropriately normalized and enriched input logs of at least 30 days for proper baselines. LogPoint provides the UEBA PreConfiguration Plugin for easy configuration of the enrichment sources and the enrichment policy. Refer to the UEBA PreConfiguration Plugin Guide for details on preparing your input logs.
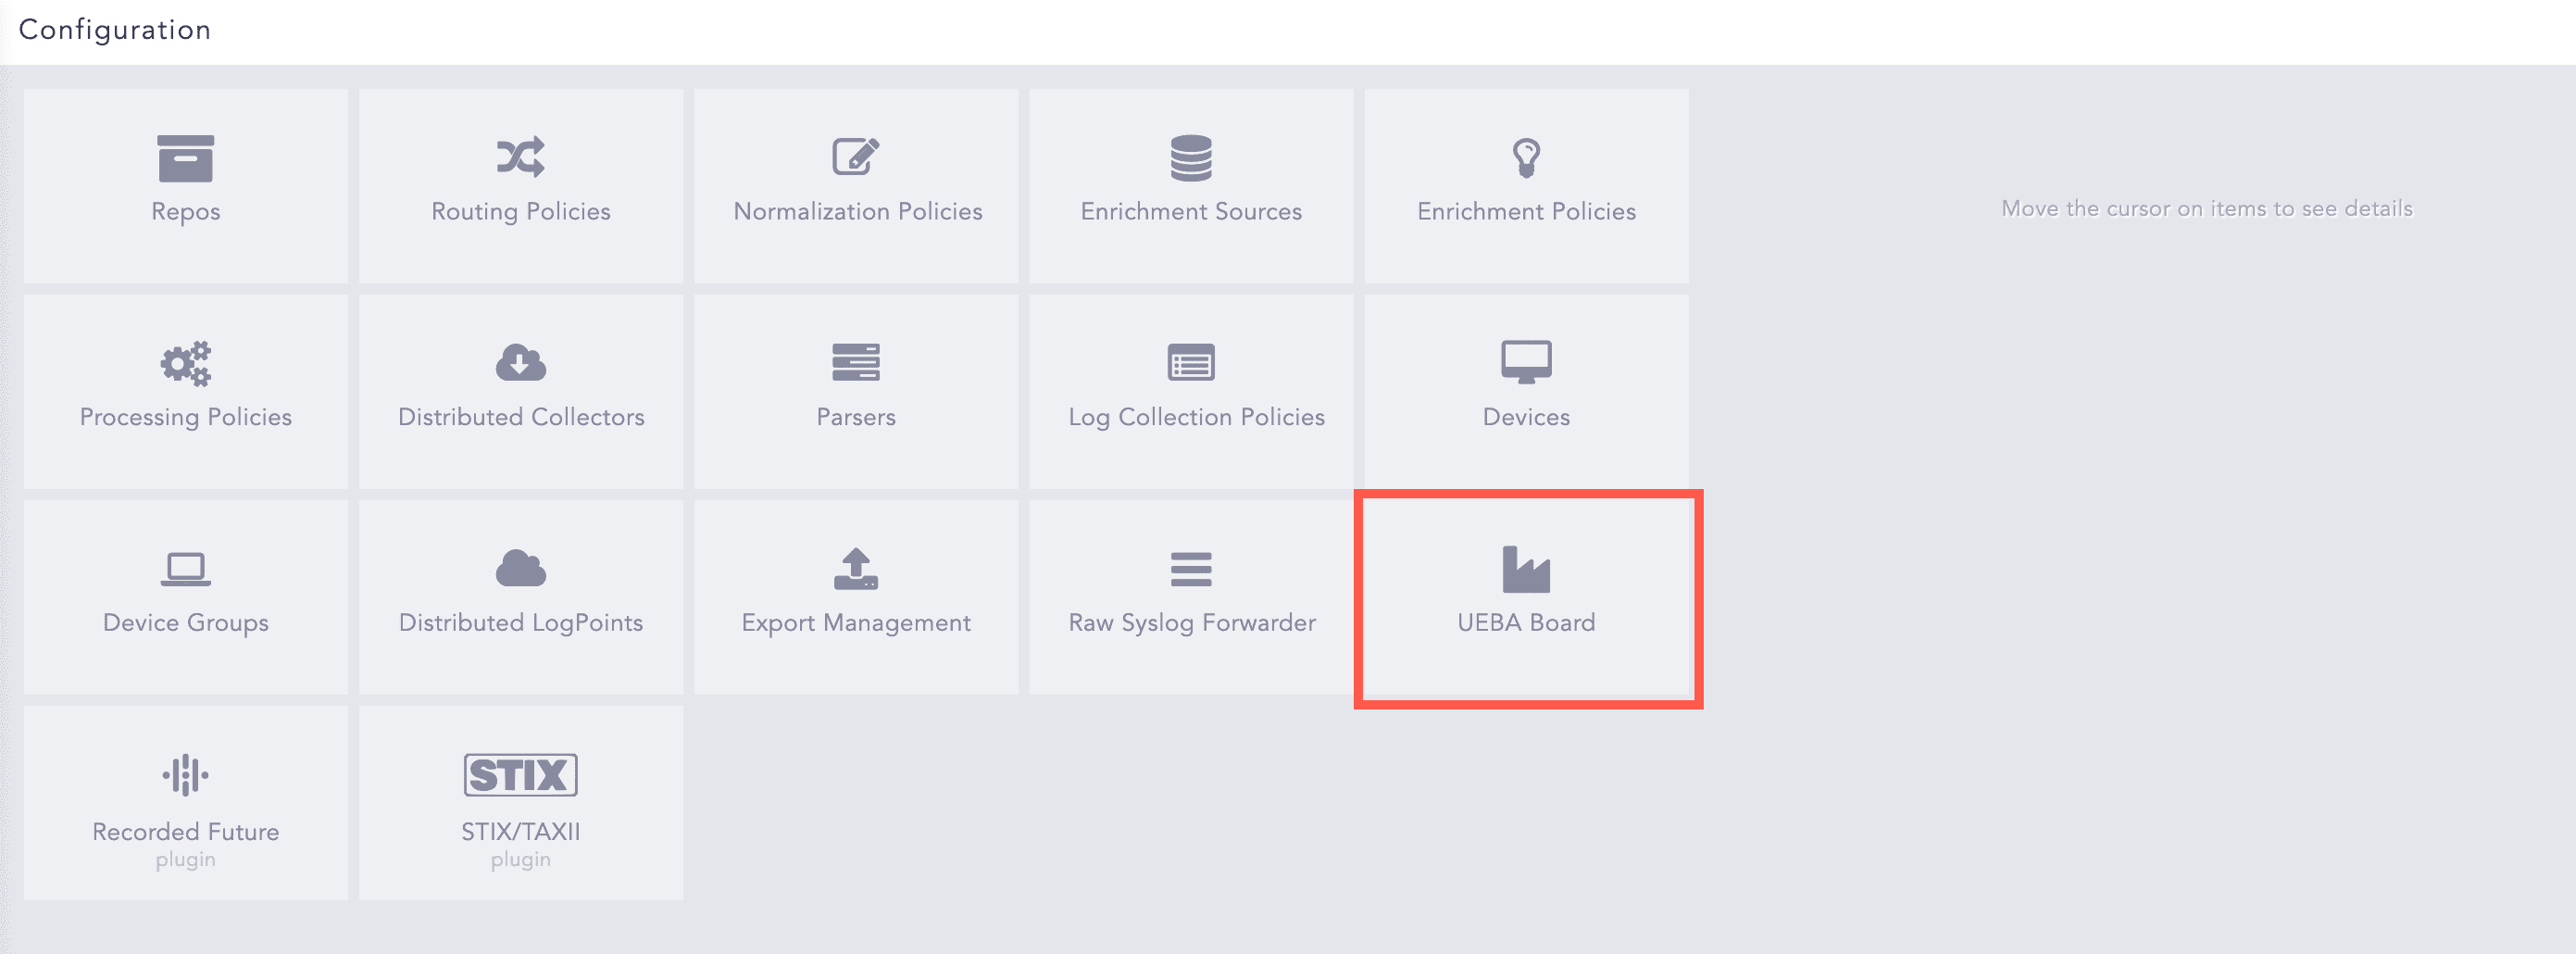
Go to Settings >> Configuration from the navigation bar and click UEBA Board.
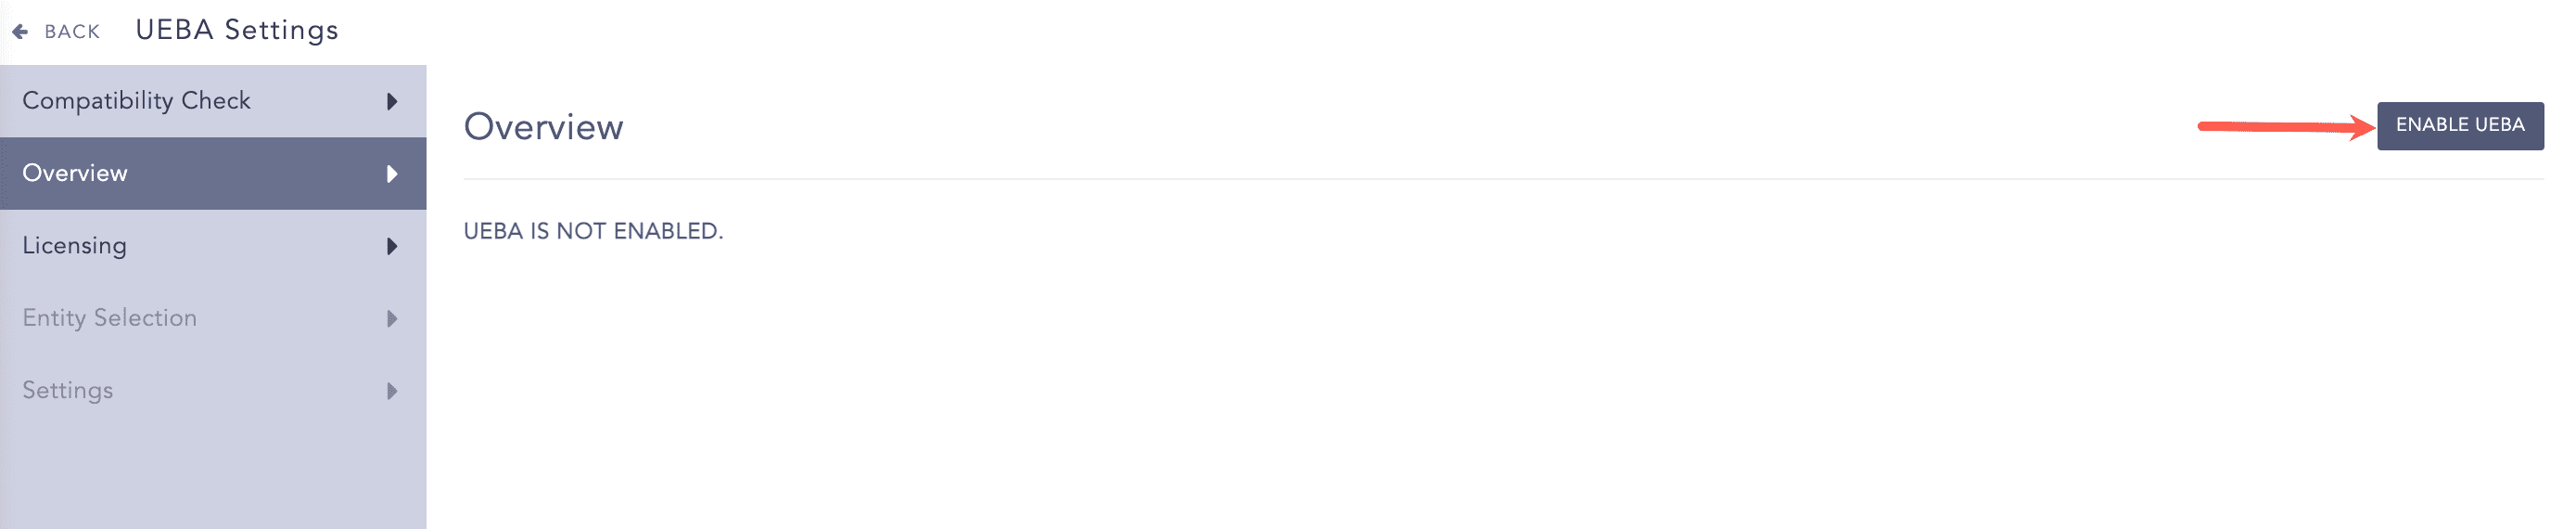
Select the Overview tab.
Click Disable UEBA.
Disabling UEBA
Click Yes.
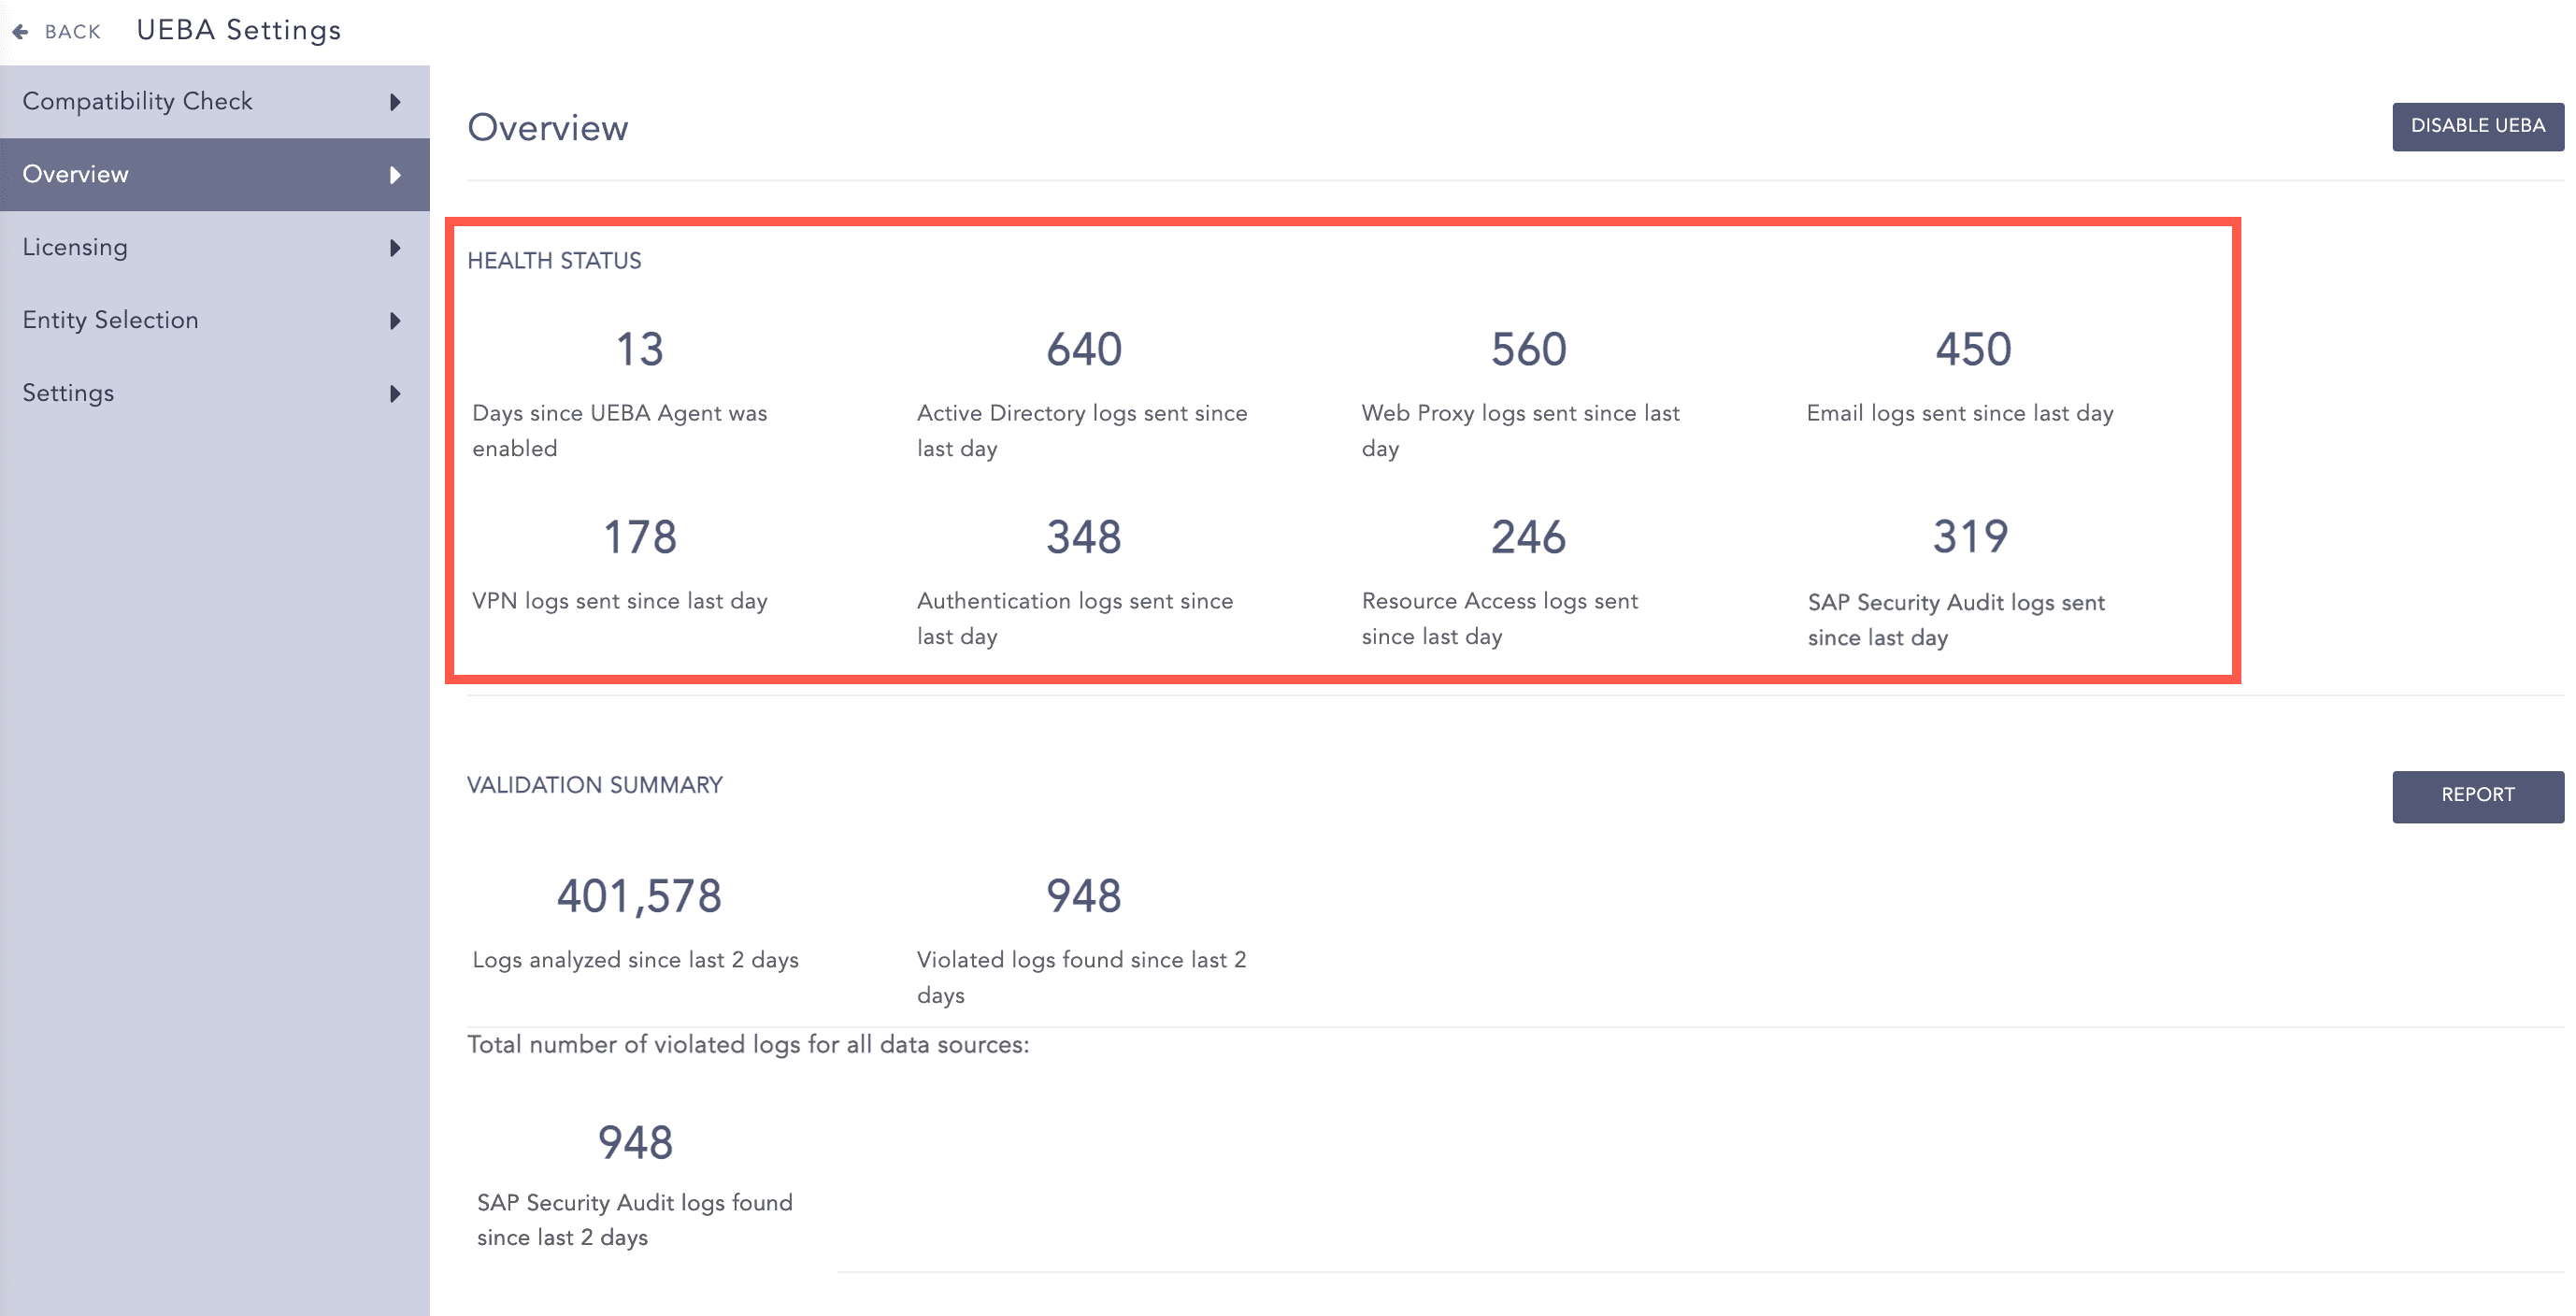
The Health Status section contains the following information:
The number of days UEBA has been enabled in the LogPoint.
The number of Active Directory logs sent for UEBA analysis in the last 24 hours.
The number of web proxy logs sent for UEBA analysis in the last 24 hours.
The number of email logs sent for UEBA analysis in the last 24 hours.
The number of VPN logs sent for UEBA analysis in the last 24 hours.
The number of authentication logs sent for UEBA analysis in the last 24 hours.
The number of resource access logs sent for UEBA analysis in the last 24 hours.
The number of SAP security audit logs sent for UEBA analysis in the last 24 hours.
Health Status
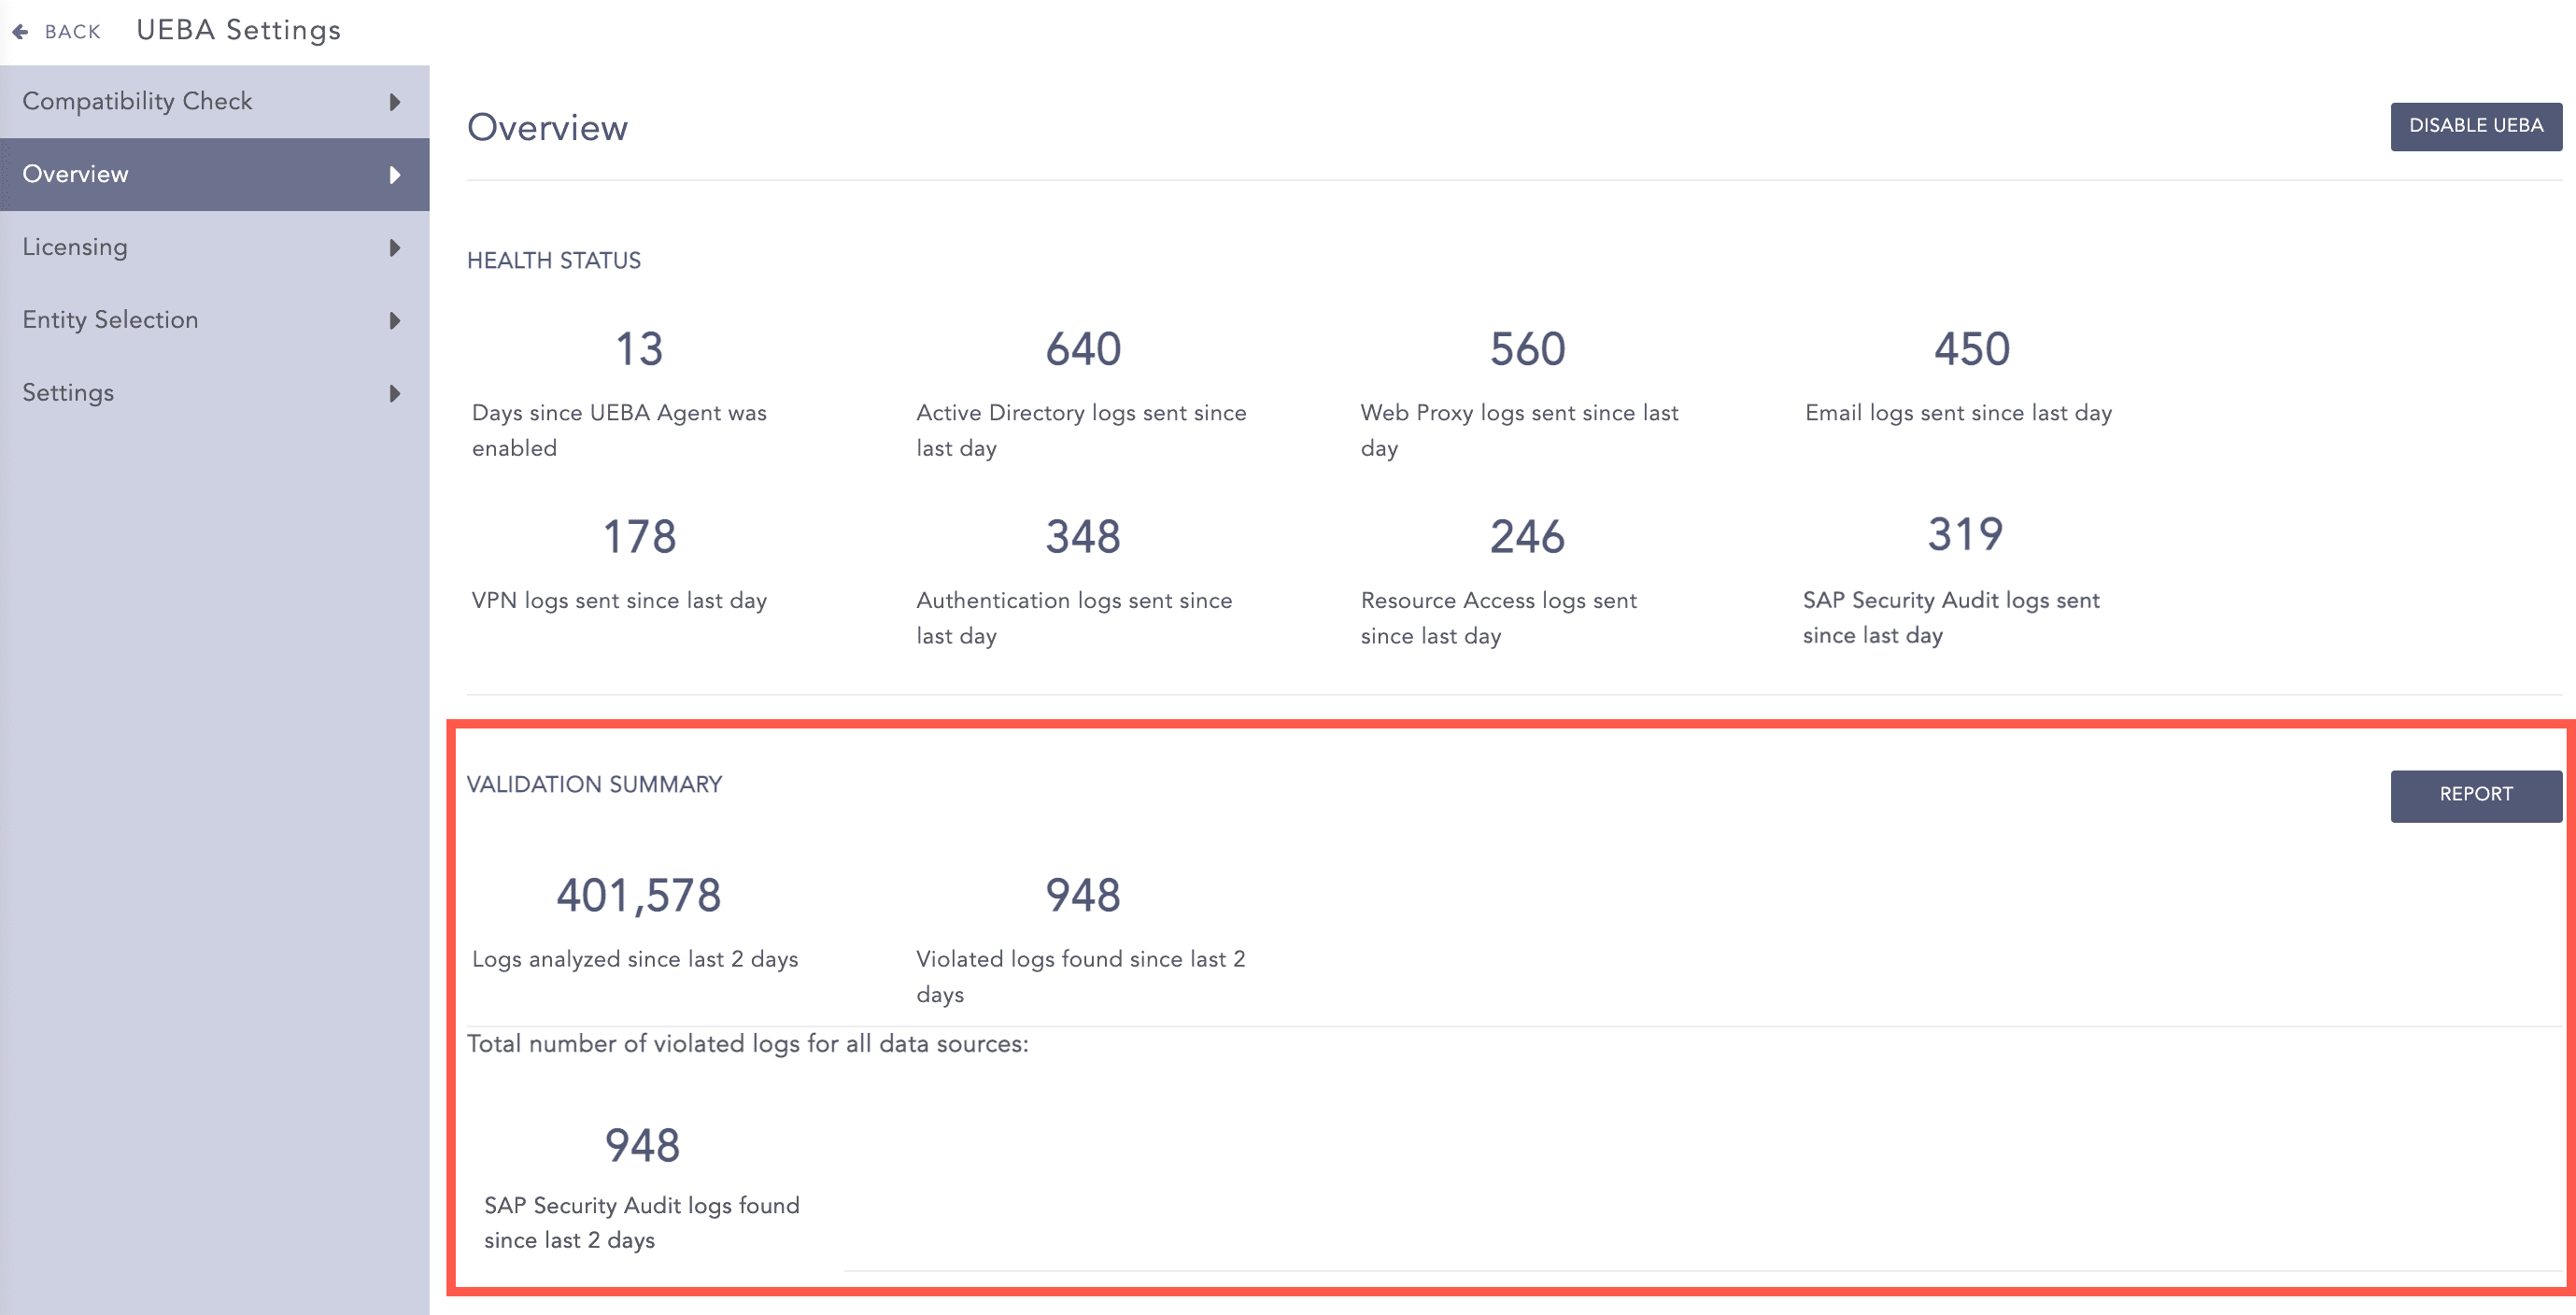
The Validation Summary section contains the following information:
The total number of logs, both historical and real-time logs, analyzed in the last two days for data validation.
The total number of invalid logs detected in the last two days while running the validation.
The total number of invalid logs found according to the different data sources.
UEBA Validation Summary
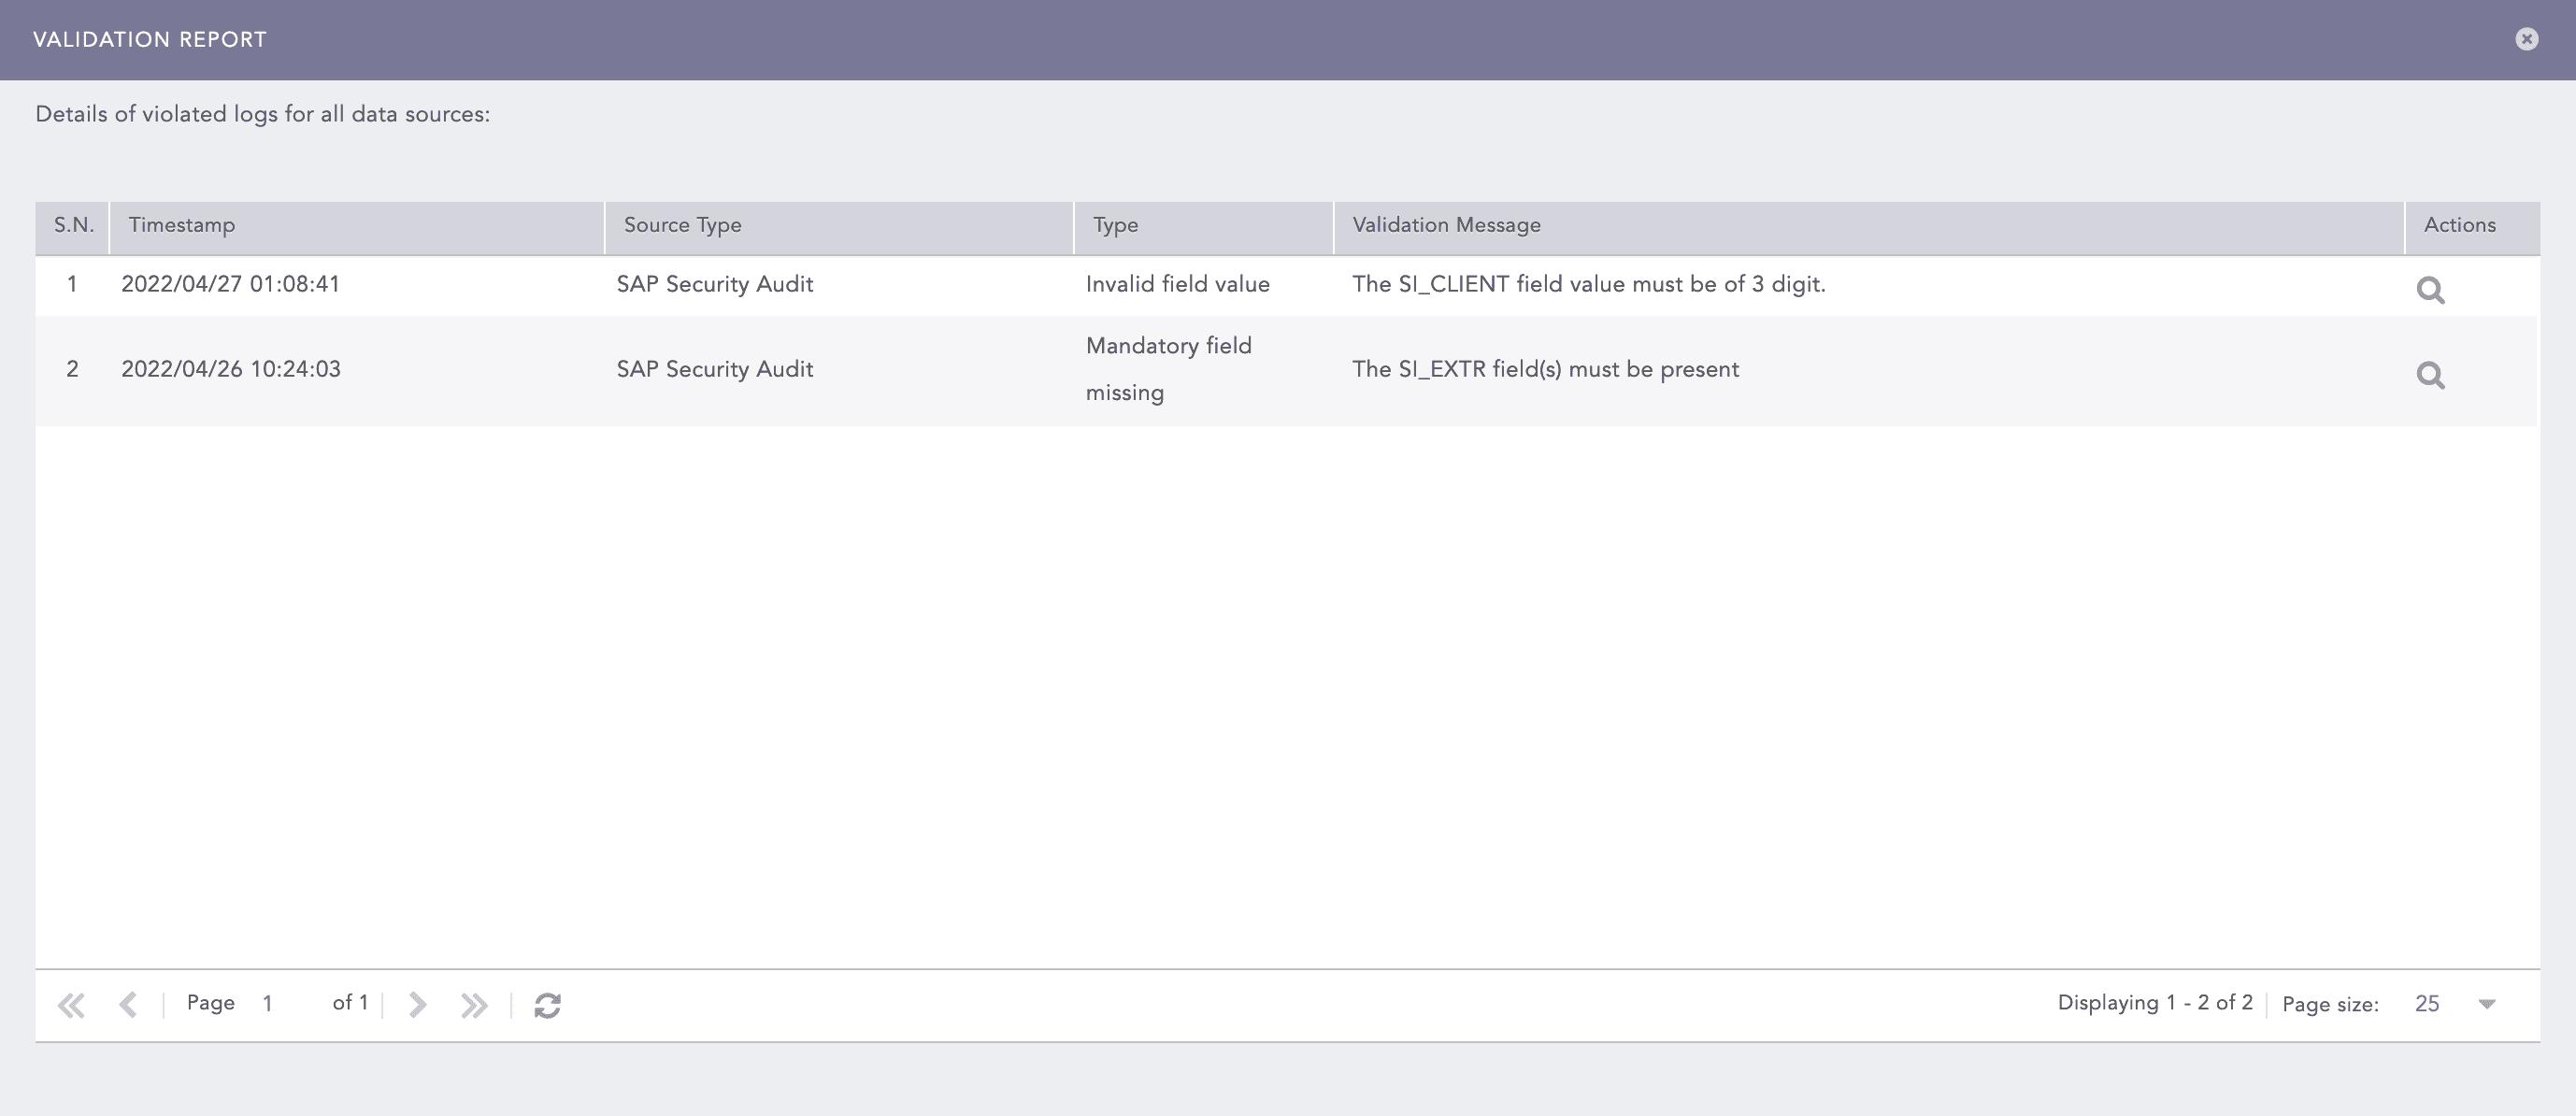
LogPoint provides the following information regarding the invalid logs:
S.N |
Field |
Description |
1 |
Timestamp |
Shows the date and time of the violation. |
2 |
Source Type |
Shows the data source of the violation: Active Directory, web proxy, email, VPN, authentication, resource access or SAP security audit. |
3 |
Type |
Shows the violation type: whether the mandatory fields are missing or the field value is invalid. |
4 |
Validation Message |
Provides detail of the violation. |
5 |
Actions |
Enables you to search for the respective violation at the particular timestamp by clicking the Search Log icon. |
UEBA Validation Report